
Learn Trading: The Ultimate Free Trading Guide for Beginners
Introduction to Trading: A Complete Beginner’s Overview
Trading is the activity of buying and selling financial instruments with the objective of generating profit from price movements. Unlike long-term investing, trading focuses on shorter time horizons and requires a structured approach, risk control, and continuous learning. This guide is designed as a complete, free, and practical resource for beginners and intermediate traders who want a solid foundation and realistic expectations.
This guide covers everything that is genuinely useful: concepts, markets, strategies, psychology, risk management, tools, and a clear learning path.
1. What Is Trading? Definition, Reality, and Common Myths
1.1 What Trading Is
At its core, trading involves speculating on asset price movements using a blend of analysis, discipline, and capital management. It’s akin to a high-stakes game of probabilities, where you identify setups with a statistical advantage.
- Speculating on Price Movements: Traders exploit inefficiencies, such as arbitrage opportunities or momentum bursts. For instance, during the 2020 COVID-19 market crash, savvy traders shorted overvalued stocks like airlines while going long on tech giants like Zoom, profiting from rapid shifts.
- Using Analysis and Probability: Decisions aren’t guesses; they’re informed by data. Expectancy formula: (Win Rate × Average Win) – (Loss Rate × Average Loss) > 0. A 50% win rate with 1:2 risk-reward can be profitable, as losses are capped while wins compound.
- Managing Risk Before Seeking Profits: Legendary trader Ed Seykota’s mantra: “Cut losses short, let winners run.” This means defining exit points pre-entry to preserve capital during inevitable drawdowns (e.g., a 20% account drop from a string of losses).
- A Skill-Based Activity: Like mastering a sport, trading evolves through backtesting, forward-testing, and review. Novices start with basic patterns; experts incorporate machine learning for predictive edges, as seen in firms like Two Sigma.
Trading demands adaptability—markets evolve with regulations, technology (e.g., high-frequency trading), and global events.
1.2 What Trading Is NOT
Dispelling myths is crucial to avoid disillusionment.
- A Guaranteed Way to Make Money: Markets are adversarial; liquidity providers and institutions often have informational edges. Studies from the European Securities and Markets Authority (ESMA) show 74-89% of retail CFD accounts lose money.
- Gambling or Guessing: Gambling has negative expectancy (house edge); trading seeks positive edges via tested strategies. Avoid “gut feels”—rely on evidence.
- A Get-Rich-Quick System: Scams promise 100% monthly returns, but realistic pros aim for 1-5% monthly with low drawdowns. Paul Tudor Jones’ 1987 Black Monday trade netted millions through preparation, not luck.
- Easy or Passive Income: It requires active engagement—monitoring news, adjusting positions. Passive alternatives? ETFs like SPY for broad exposure.
Professionals emphasize process: Journaling trades, reviewing performance metrics (e.g., Sharpe ratio >1 for risk-adjusted returns), and maintaining work-life balance to prevent burnout.
2. Financial Markets You Can Trade
2.1 Forex (Foreign Exchange)
The forex market’s liquidity stems from its decentralized nature (OTC via banks/brokers). Major pairs like EUR/USD move on economic differentials—e.g., ECB dovish policy weakening EUR. In 2025, AI-driven sentiment analysis from sources like X (formerly Twitter) influenced flash crashes. Start with demo accounts on platforms like MetaTrader 5; watch for slippage during high-impact news like NFP reports.
2.2 Stocks
Equity trading offers variety: Blue-chips for stability, growth stocks for volatility. Factors include insider buying (tracked via SEC filings) or options flow. Example: Nvidia’s AI boom in 2023-2025 drove 10x gains, but corrections wiped amateurs. Use scanners like Finviz for setups.
2.3 Indices
Indices smooth individual stock risks—e.g., S&P 500’s 2024-2025 rally on AI hype. Trade via ETFs (SPY) or futures (ES). Less prone to gaps than stocks.
2.4 Cryptocurrencies
Post-2024 halving, BTC hit new highs amid institutional adoption (e.g., BlackRock ETFs). Volatility from whale moves or hacks; use on-chain metrics like Glassnode for insights.
2.5 Commodities
Gold as inflation hedge surged in 2025 amid rate cuts. Oil volatility from Middle East tensions. Trade futures or ETFs like GLD.
3. Types of Trading Styles
3.1 Scalping
High-frequency: Target 5-20 trades/hour. Example: Scalp EUR/USD during London open volatility. Tools: Level 2 data for order flow. Pitfall: Broker requotes; solution: ECN accounts.
3.2 Day Trading
Intraday focus avoids overnight holds. Case: Trade AAPL post-earnings gaps. Requires PDT compliance; build routines like pre-market scans.
3.3 Swing Trading
Captures multi-day swings. Example: Buy pullback in uptrending TSLA on 4H chart. Balances work; use alerts.
3.4 Position Trading
Macro-driven: Hold USD/JPY long on yield spreads. Low frequency; monitor quarterly.
4. Market Mechanics and Core Concepts
4.1 Bid and Ask
Spread dynamics: Tight in liquid markets (0.1 pip EUR/USD), wide in illiquid (e.g., crypto during low volume). Hidden cost: Impacts scalpers most.
4.2 Liquidity
Depth affects execution—e.g., iceberg orders hide size. Measure via order book.
4.3 Volatility
ATR calculation: Average of true ranges over 14 periods. High vol = wider stops; use for position sizing.
4.4 Leverage
Math: With 1:50 leverage, $2K controls $100K. 2% adverse move = 100% loss. Limit to 1:10; regulators cap retail at 1:30 in many jurisdictions.
5. Technical Analysis (Core of Trading)
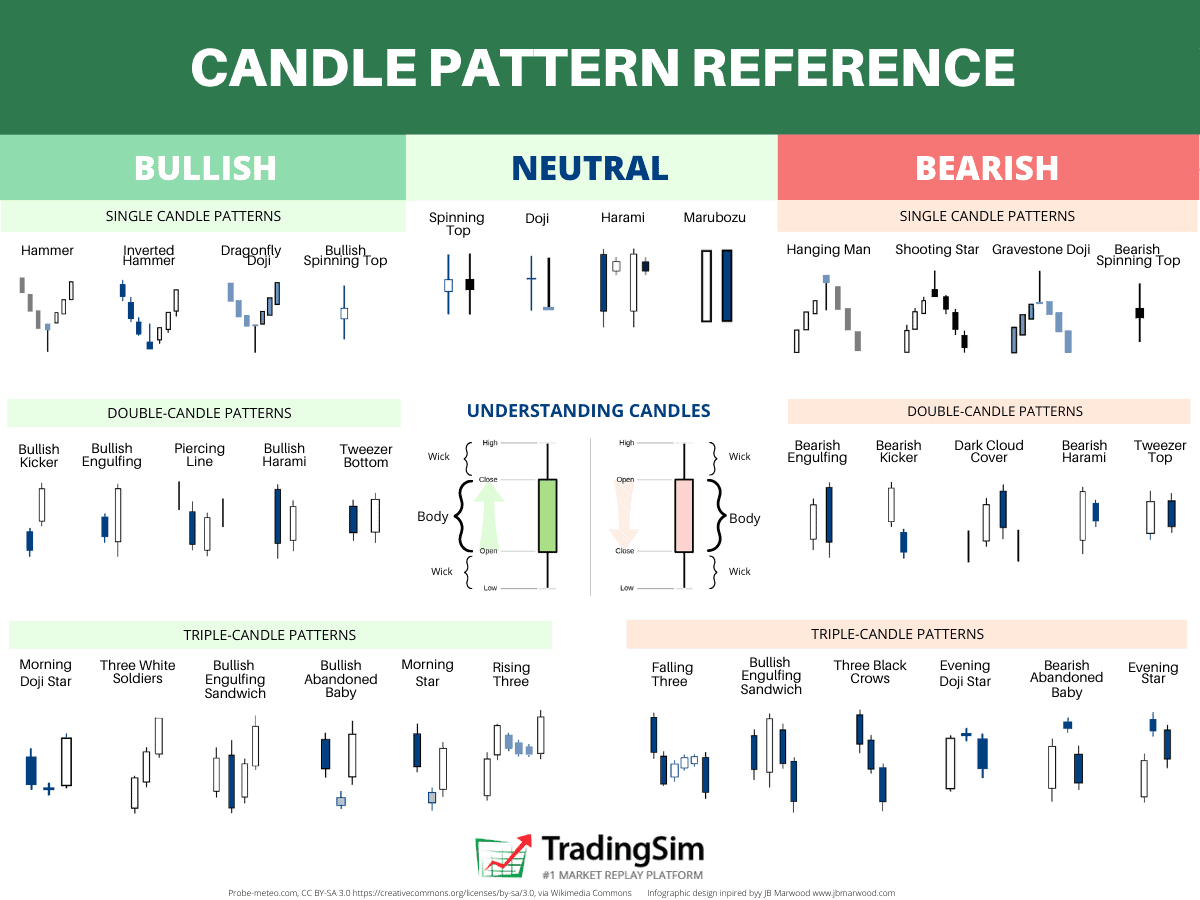
Candlestick Basics
OHLC details psychology—e.g., doji for indecision. Common patterns: Hammer (bullish reversal), engulfing.
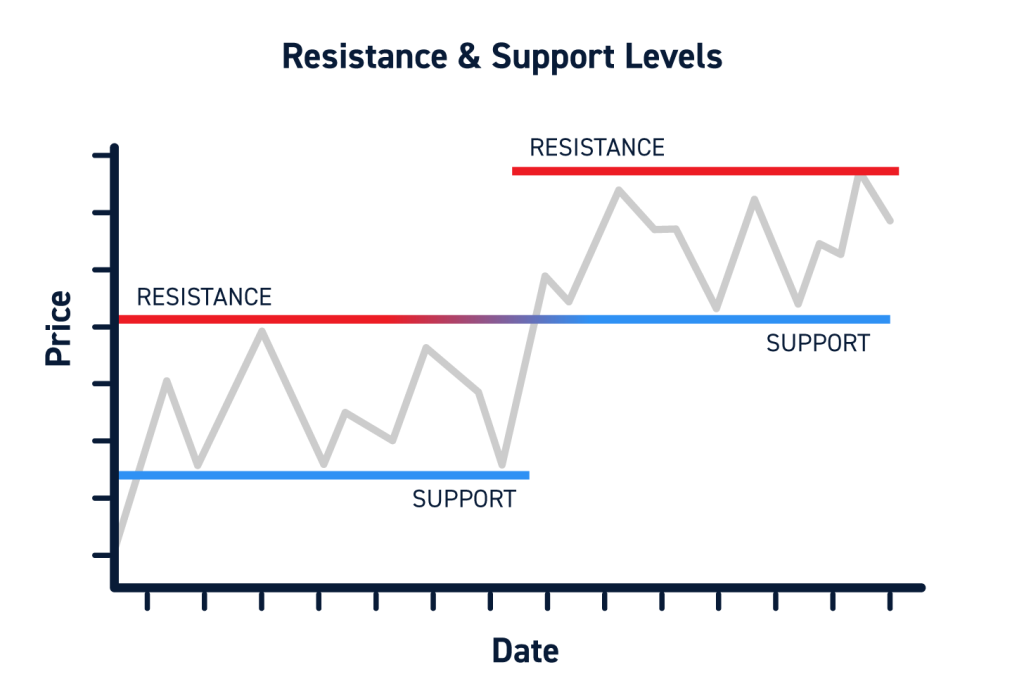
Support and Resistance
Zones form from historical pivots. Role reversal: Broken resistance becomes support.
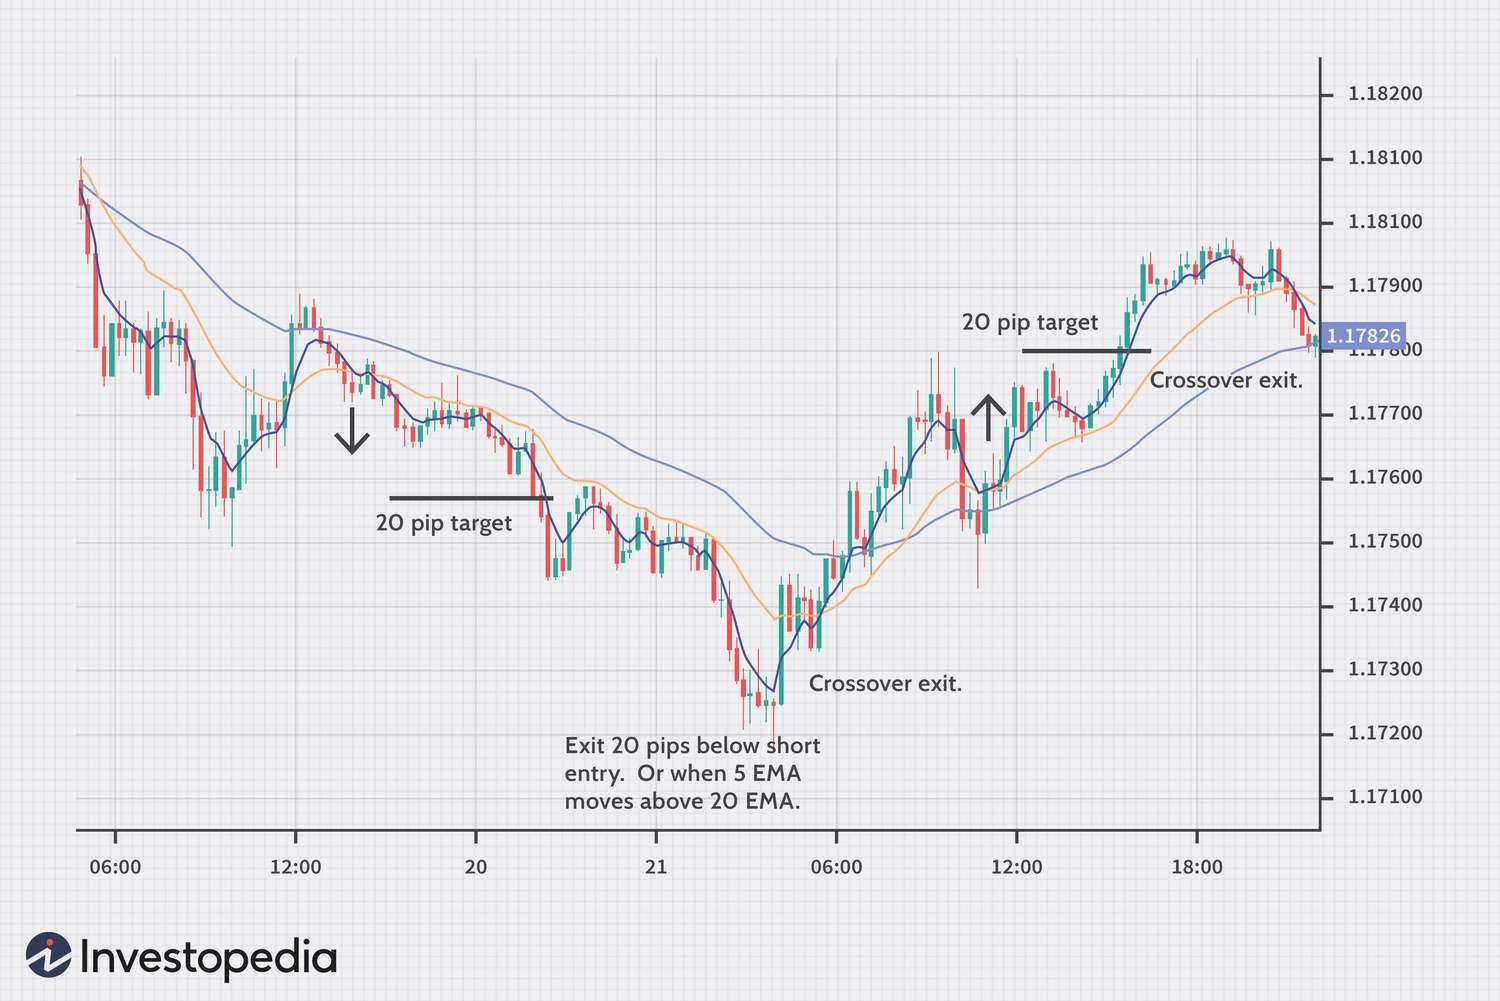
Indicators (Use Sparingly)
Moving Averages: EMA(50) for short-term, SMA(200) for long. Crossover: Golden (50>200 bull), Death (vice versa)
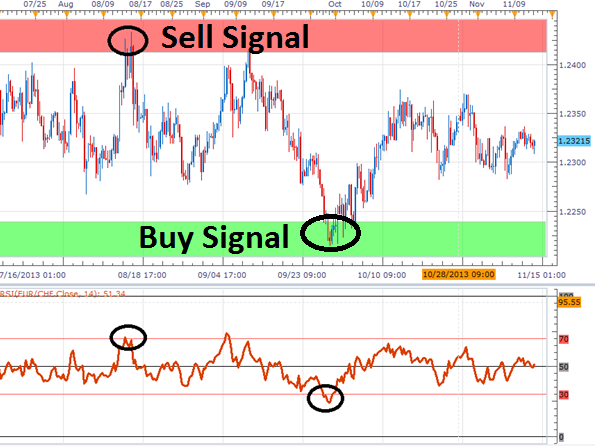
RSI showing overbought (>70) and oversold (<30) zones, useful for mean reversion.
6.Fundamental Analysis
6.1 Economic Data
- Interest Rates: Taylor Rule estimates fair rates; deviations signal moves.
- Inflation (CPI): Core vs. headline; persistent >2% prompts hikes.
- Employment: ADP previews NFP; surprises >50K move markets 0.5-1%.
Track correlations: e.g., strong USD on high US yields.
6.2 News and Events
- Central Banks: Forward guidance sways sentiment—e.g., 2025 Fed pivot boosted equities.
- Earnings: EPS beats by 5%+ rally stocks; forward P/E for valuation.
- Geopolitics: Trade wars add premiums; monitor via sources like Reuters.
Use event risk: Avoid trades pre-high-impact releases or use straddles.
7. Risk Management (The Most Important Section)
7.1 Risk Per Trade
1-2% rule: On $50K account, risk $500-1K. Protects from 10-loss streaks (10-20% drawdown max).
7.2 Stop Loss
Types: Hard (market order), trailing (locks profits). Placement: Beyond volatility (e.g., 1.5x ATR).
7.3 Risk-to-Reward Ratio
Aim 1:3 for conservative. Example: Risk 100 pips to gain 300; 33% win rate breaks even.
7.4 Position Sizing
Formula: Size = (Account × Risk%) / (Stop Distance × Pip Value). Example: $10K account, 1% risk, 50-pip stop, $10/pip = 2 lots.
Use spreadsheets for automation.
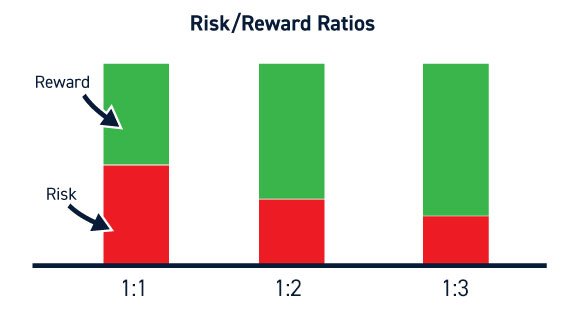
This diagram explains risk-reward visually, showing how ratios affect profitability.
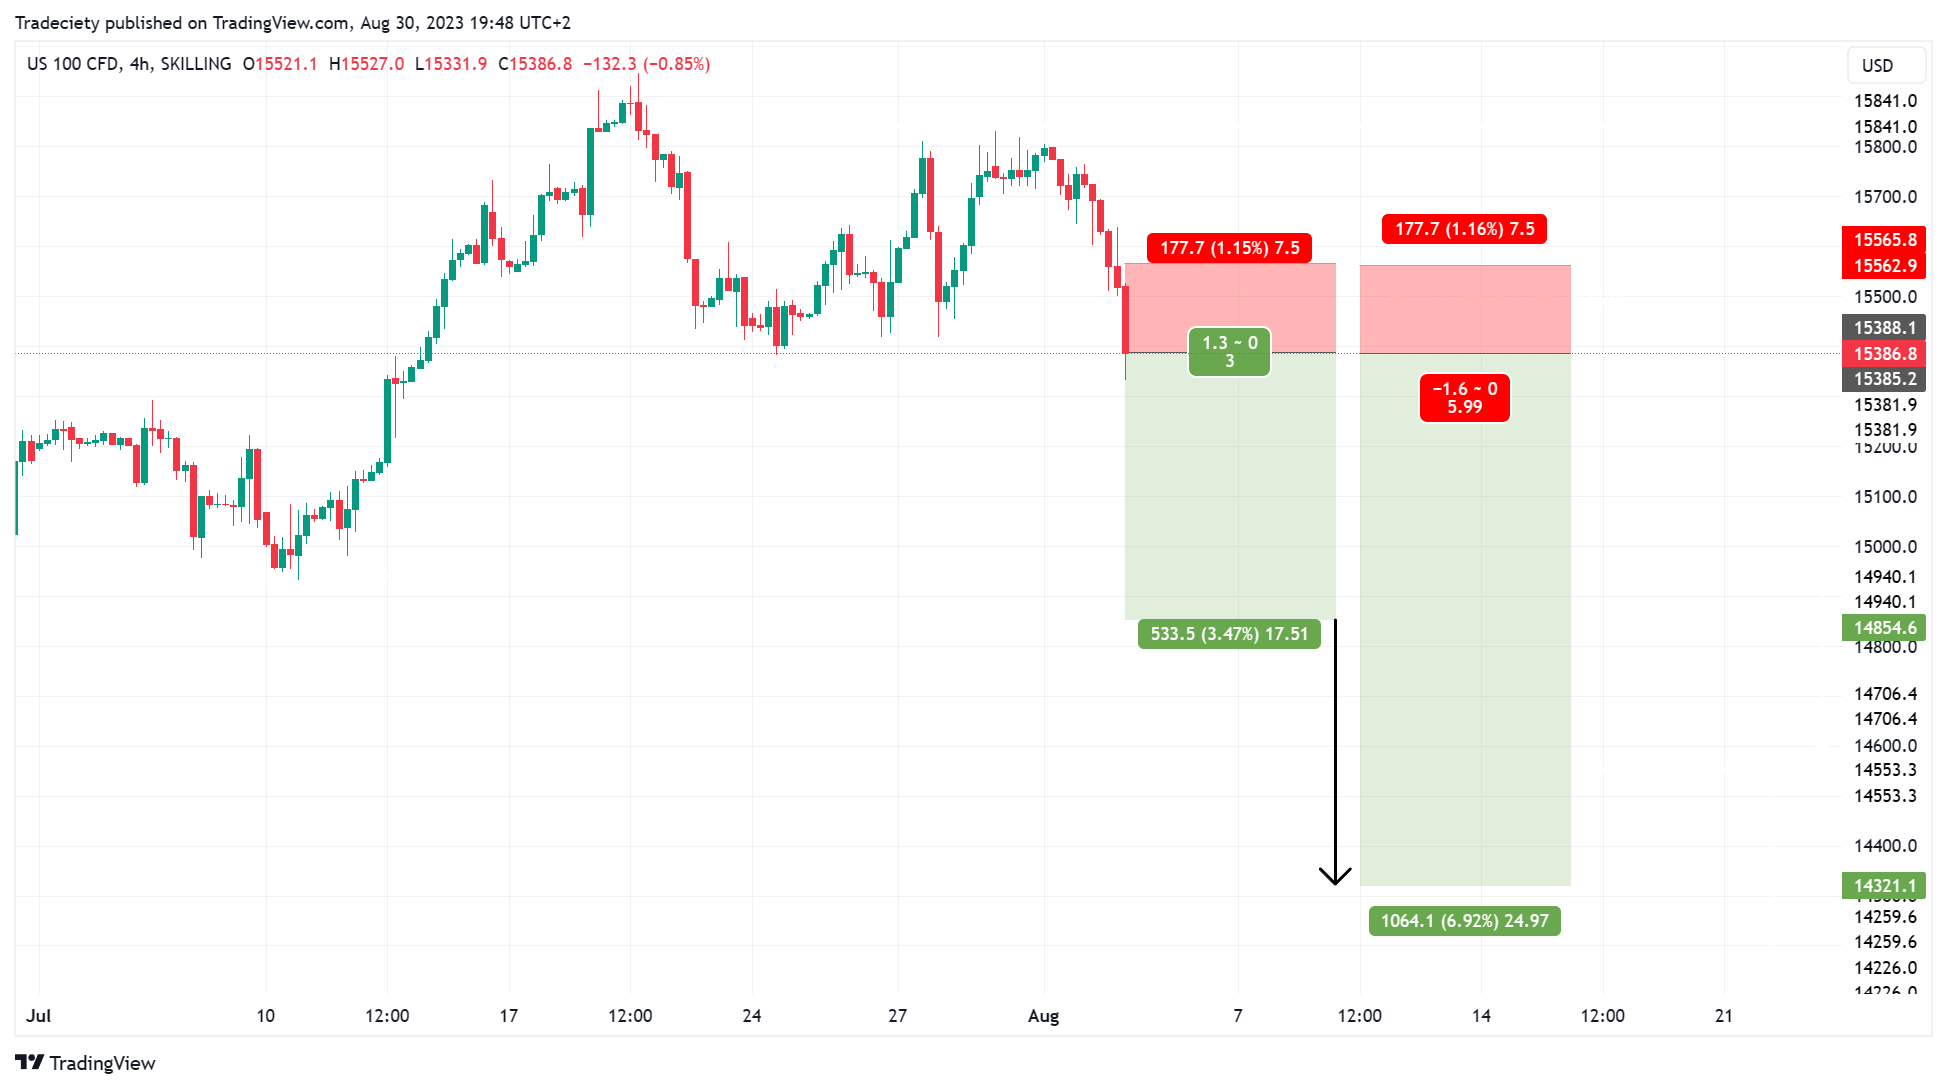
Another illustration on a real trade setup.

8. Trading Psychology
Brett Steenbarger’s works highlight: Emotions derail 70% of traders.
8.1 Common Psychological Traps
- FOMO: Solution: Wait for pullbacks.
- Revenge Trading: After loss, pause 24 hours.
- Overtrading: Limit to 3-5 setups/day.
- Confirmation Bias: Seek disconfirming evidence.
8.2 Discipline
Rules: If-then statements (e.g., If RSI<30 and trend up, then buy).
8.3 Emotional Control
Techniques: Mindfulness apps, position sizing to reduce stress. Accept: Even pros lose 40-60% of trades.
9. Trading Strategies (Frameworks)
Trading strategies serve as structured frameworks to guide your decisions in the markets, reducing emotional impulses and increasing the probability of consistent results. No single strategy guarantees success—markets cycle through trending, ranging, and volatile phases, so adaptability is key. Before implementing any, backtest on historical data (at least 100 trades across different market conditions) using tools like TradingView’s replay feature or QuantConnect. Then, forward-test in a demo account for 1-3 months to simulate live conditions, tracking metrics like win rate, average profit/loss, and maximum drawdown. In 2026, with AI-driven tools like TrendSpider automating pattern recognition, strategies can be refined faster, but human oversight remains crucial to avoid overfitting.
Pros of systematic strategies: Objective rules minimize bias; scalable with automation. Cons: All fail in certain regimes (e.g., trend strategies flop in ranges); requires discipline to follow during losing streaks.
Always combine with multi-timeframe analysis (MTFA): Confirm daily trends for hourly entries to align with broader momentum. Example: Use a 4-hour chart for direction, 15-minute for precise timing.
9.1 Trend Following
Trend following capitalizes on sustained price movements, assuming “the trend is your friend” until proven otherwise. Core idea: Enter in the direction of the prevailing trend, riding momentum while cutting losses quickly on reversals. Tools like the Average Directional Index (ADX) measure trend strength—ADX >25 indicates a strong trend worth pursuing; >40 signals extreme momentum (but watch for exhaustion).
Example: In Bitcoin’s 2025 uptrend (post-halving rally), identify higher highs/lows on the daily chart. Buy dips to a 50-period EMA during pullbacks, with stops below recent lows. Target: Trail stops using Parabolic SAR or a 20% trailing stop. Historical backtests on indices like S&P 500 show trend following yielding 8-12% annualized returns in bull markets, per studies from AQR Capital.
Pros: High reward in strong trends; simple. Cons: Whipsaws in choppy markets; late entries miss initial moves.
To enhance: Filter with volume (rising in trend direction) or momentum oscillators like Momentum Indicator (14-period >0 for uptrends).
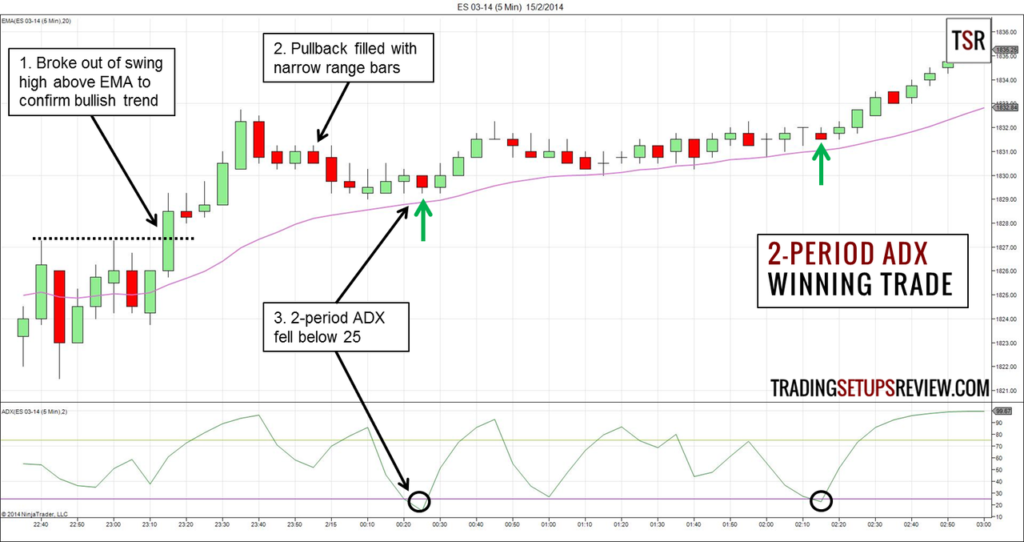
This chart illustrates a 2-period ADX trend trading strategy on a real asset, highlighting entry points during strong trends.
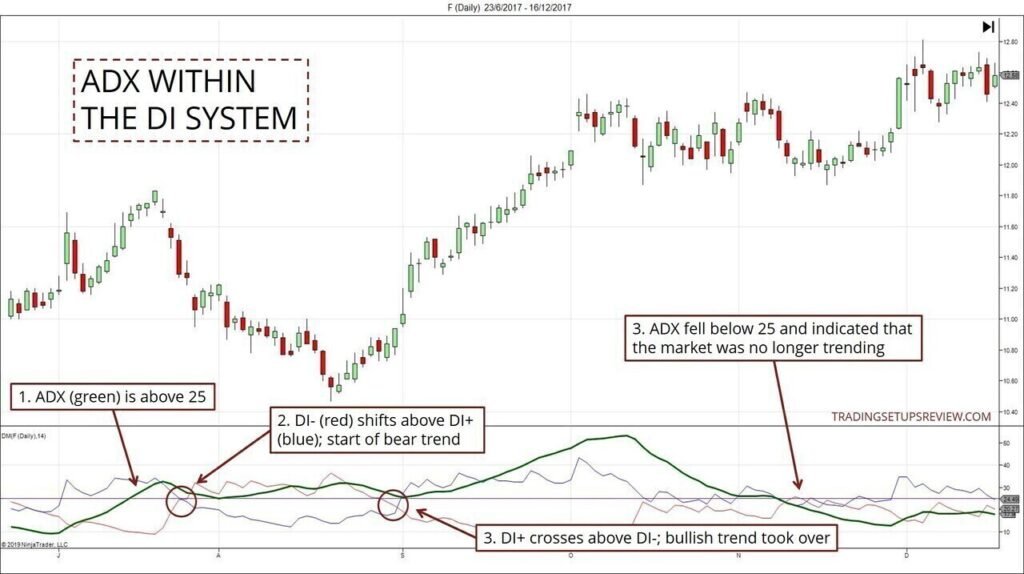
Another example showing ADX integration in a directional index system, useful for confirming trend strength.
9.2 Breakout Trading
Breakouts occur when price surpasses key support/resistance levels, often signaling the start of a new trend or acceleration. The key is confirmation to avoid “fakeouts”—false breaks that trap traders. Wait for a volume surge (at least 1.5x average) to validate, as institutional buying drives sustainable moves.
Example: On a stock like NVDA in 2025 AI hype, watch for consolidation above resistance (e.g., $150). Enter long on a close above with volume spike; use retest entries (price pulls back to test the broken level as support) for better risk-reward. Stop below the breakout level; target 1:3 R:R based on prior range expansion.
Pros: Explosive profits in volatile assets like crypto; clear rules. Cons: High failure rate (50-60% per Ed Seykota’s data); slippage in low-liquidity markets.
Avoid traps: Require candle closes beyond levels, not intrabar wicks. In 2026, tools like Finviz scanners alert real-time breakouts.
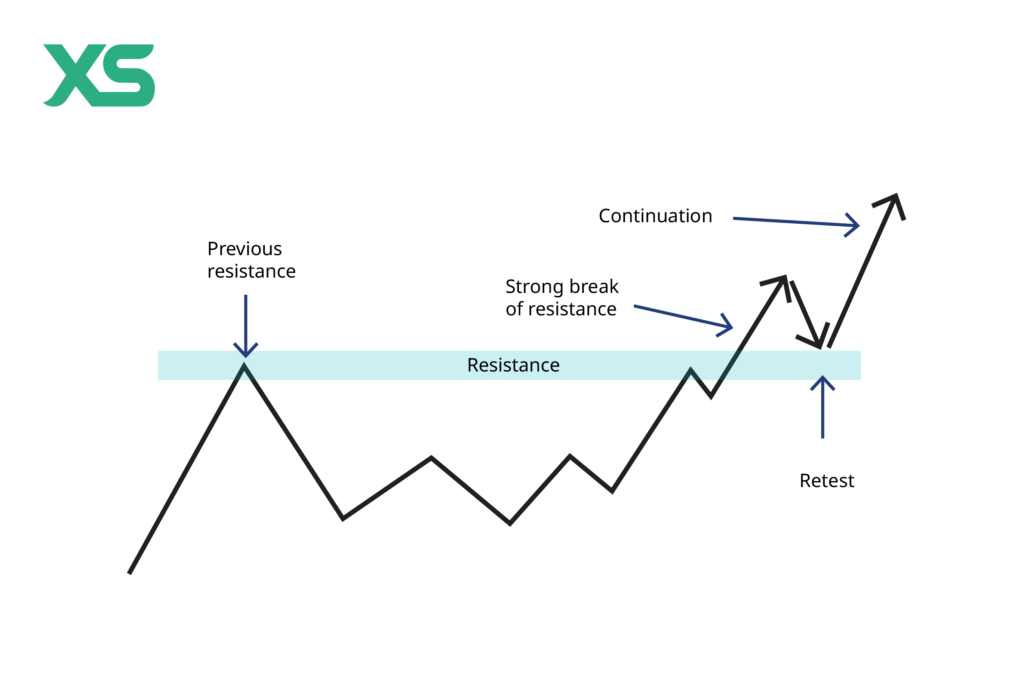
Visualize a break and retest setup, common in forex pairs, showing the pullback entry post-breakout.
9.3 Mean Reversion
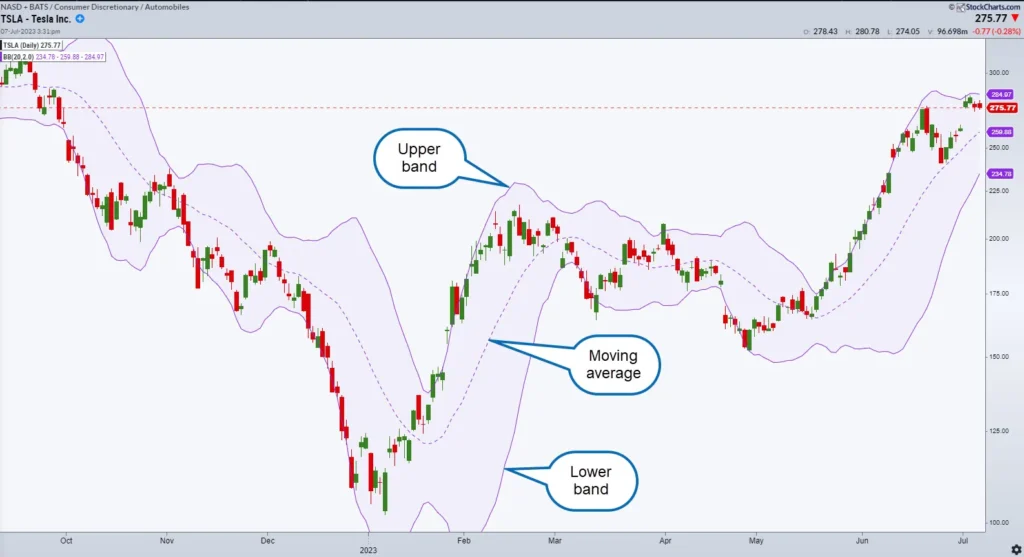
Mean reversion bets on prices returning to their historical average after deviations, thriving in range-bound markets. It’s counter-trend: Buy oversold, sell overbought. Bollinger Bands (20-period, 2 SD) are ideal—buy lower band touches in uptrends or ranges, with RSI <30 confirming exhaustion.
Example: In a sideways EUR/USD (2025 range amid ECB stability), enter long on lower Bollinger touch if price rejects and volume picks up. Stop below the band; target the middle band or opposite side.
Pros: High win rates (60-70%) in ranges; frequent setups. Cons: Deadly in trends (e.g., “catching falling knives”); requires quick exits.
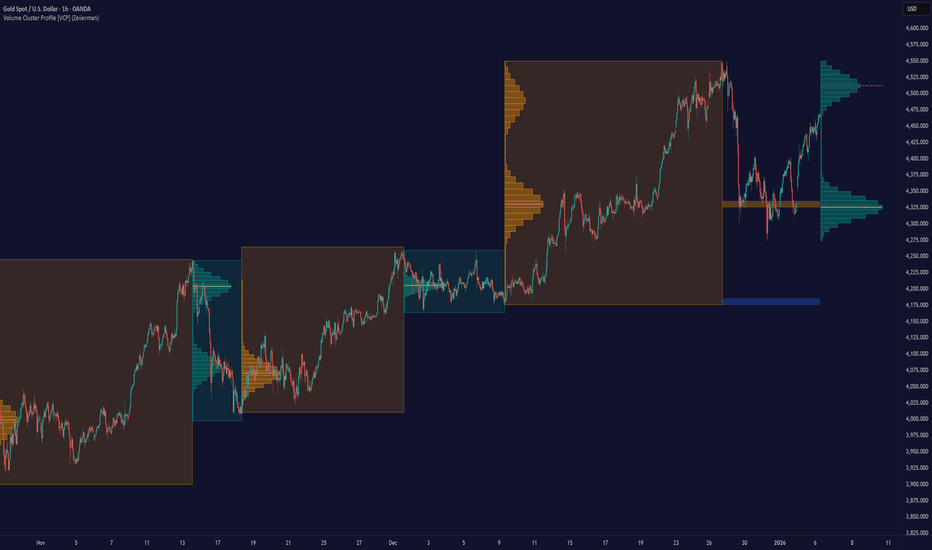
Adapt: Use with MTFA—ensure daily range before hourly reversions. Backtests on commodities like gold show 10%+ returns in low-vol periods.
10. Tools Every Trader Needs
In 2026, trading tools have evolved with AI integration, offering predictive analytics and automated alerts. Essentials remain charts, data feeds, and trackers, but free options abound. From web searches , top free platforms include TradingView (charts), Yahoo Finance (news), Finviz (scanners), and Stock Rover (fundamentals). Brokers like Fidelity, Webull, and Interactive Brokers offer commission-free trades with built-in tools.
11. Trading Plan (Non-Negotiable)
A trading plan is your operational blueprint, turning trading into a business. Expand it to include contingencies like max daily loss (3% to halt trading, preventing tilt) and scenario planning (e.g., “If volatility spikes, reduce size 50%”). Review monthly: Analyze journal data, adjust rules if win rate dips below 45%. In 2026, use AI journals to auto-flag biases.
Core Elements:
- Markets/Timeframes: e.g., Stocks, 1H-4H.
- Strategy Rules: Entry/exit criteria, filters.
- Risk Rules: 1% per trade, 1:2+ R:R.
- Schedule: Trade during high-liquidity sessions (e.g., NY open).
- Psychology: Daily routines (meditation), max trades/day (5).
- Performance Metrics: Track Sharpe ratio (>1 ideal).
Test via demo; iterate based on results. No plan? Expect random outcomes.

12. Learning Path (Realistic)
Building trading skills is iterative—expect 6-24 months to consistency. From resources , free options: Coursera (Practical Guide to Trading), Udemy free tutorials, YouTube (Humbled Trader for day trading), Khan Academy (finance basics), IG Academy (forex), Yale’s Financial Markets course, Wharton Online blogs.
- Basics: Free courses on Khan Academy or Coursera for terminology/economics. Read “Trading for a Living” by Elder.
- Price Action: Practice on historical charts via TradingView replay. Identify 100 patterns manually.
- Demo: Aim for 500 trades; calculate expectancy = (Win% * Avg Win) – (Loss% * Avg Loss).
- Journaling: Use TradeZella or free apps; review weekly for patterns.
- Live: Start with micro lots ($100-500 account); scale after 3 profitable months (e.g., +5% net).
- Scale: Increase risk gradually (0.5% increments); diversify strategies.
Add Mentorship: Forums like Elite Trader, Reddit’s r/Daytrading, or paid communities like Warrior Trading. In 2026, AI tutors on platforms like Forex Tester simulate coaching.
13. Common Beginner Mistakes
From analyses , top pitfalls: No plan (emotional trades), ignoring risk (no stops), overtrading (FOMO), lack of knowledge (jumping in blindly), holding losers too long.
- Overleveraging: Amplifies losses; fix: Cap at account size/10 (e.g., $10K account = 1:10 max).
- Strategy Hopping: Shiny object syndrome; commit 6 months per system, backtest first.
- Ignoring Risk: No stops = unlimited downside; mandate on every trade, audit weekly.
- No Journal: Miss recurring errors; solution: Daily reviews, track emotions.
14. Final Truth About Trading
Trading mirrors entrepreneurship: 90% failure rate, but persistence with adaptation rewards the dedicated, as seen in Linda Raschke’s pivot from floors to screens. In 2026, AI augments (e.g., predictive algos) but can’t replace human intuition—learn basics first to leverage tools effectively. Prioritize health: Burnout from screen time ends careers; incorporate breaks, exercise. With discipline, risk focus, and continuous learning, join the profitable minority. Icons like Soros emphasize: “It’s not whether you’re right or wrong, but how much you make when right and lose when wrong.
Disclaimer
This expanded guide is for educational purposes only and does not constitute financial advice. Trading carries significant risk of capital loss. Always conduct due diligence, consider professional advice, and risk only disposable funds. Performance varies; no guarantees.